

Kpis for NPL Securitisation: Monitoring Deal Performance
Effective kpis for npl securitisation are crucial for monitoring the performance of non-performing loan deals, ensuring transparency and informed decision-making for investors and servicers. This article details essential metrics like collection rates, recovery rates, and delinquency ratios, which are vital for assessing portfolio health and servicer effectiveness. Understanding these kpis for npl securitisation allows stakeholders to track cash flow, evaluate workout strategies, and optimize servicer performance. Accurate investor reporting, based on these indicators, is fundamental for managing risk and maximizing returns in the complex NPL and ABS markets.
DDTalks specializes in facilitating high-value deal-making and industry networking within the European private credit, NPL, and structured finance markets. Our content draws on extensive experience organizing premium B2B financial conferences, connecting top-tier institutional investors with leading servicers and advisors.
To explore your options, contact us to schedule your consultation. You can also reach us via: Request Agenda
What are the Essential KPIs for NPL Securitisation Monitoring?
Essential Key Performance Indicators (KPIs) for monitoring Non-Performing Loan (NPL) securitisation deals include the collection rate, recovery rate, and delinquency ratio. The collection rate is often considered most critical for assessing cash flow and servicer effectiveness, but a full analysis requires a suite of metrics to evaluate portfolio health, risk, and return on investment.
Defining NPL Securitisation and KPI Significance
NPL securitisation is pooling non-performing loans and repackaging them into tradable, interest-bearing securities called Asset-Backed Securities (ABS). For investors, servicers, and rating agencies, monitoring through clear performance metrics is fundamental. These indicators provide transparency to track the underlying asset pool’s performance against initial projections and business plans.
Effective monitoring builds investor confidence and allows for timely identification of portfolio issues. Data quality and reporting consistency are paramount, as they directly influence valuation models, risk assessments, and strategic decisions for managing distressed assets. Analysis relies on accurate and well-defined kpis for npl securitisation.
Key Performance Indicators: Collection, Recovery, and Delinquency
Understanding the primary performance metrics is crucial for all parties in an NPL transaction. Each KPI offers a distinct perspective on portfolio performance, from short-term cash generation to long-term resolution success.
Collection Rate vs. Recovery Rate: Understanding the Nuance
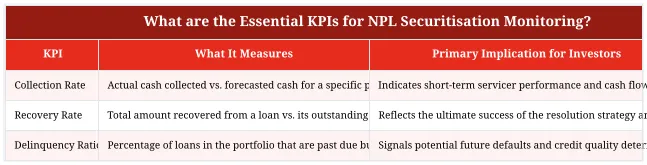
Often used interchangeably, the collection rate and recovery rate measure different performance aspects. The collection rate measures operational efficiency, typically calculated monthly or quarterly. It compares actual cash collected from the NPL portfolio against the amount forecasted in the servicer’s business plan. A consistent rate above 100% indicates the servicer is outperforming expectations.
Conversely, the recovery rate measures ultimate resolution success. It is the total gross or net proceeds recovered from a defaulted loan, expressed as a percentage of the loan’s outstanding balance at default. This metric shows the effectiveness of workout and legal strategies over the asset’s life.
View data as table
| KPI | What It Measures | Primary Implication for Investors |
|---|---|---|
| Collection Rate | Actual cash collected vs. forecasted cash for a specific period. | Indicates short-term servicer performance and cash flow predictability. |
| Recovery Rate | Total amount recovered from a loan vs. its outstanding balance at default. | Reflects the ultimate success of the resolution strategy and asset value. |
| Delinquency Ratio | Percentage of loans in the portfolio that are past due but not yet defaulted. | Signals potential future defaults and credit quality deterioration. |
Delinquency Ratio and Cumulative Default Rate Explained
The delinquency ratio tracks the percentage of loans that have missed payments but have not yet defaulted (typically 90 days past due). This forward-looking indicator helps investors gauge near-term credit risk and potential new NPL inflows. A rising delinquency ratio is an early warning sign of deteriorating portfolio quality.
The cumulative default rate measures the total value of loans that have defaulted over a period as a percentage of the initial portfolio balance. This metric provides a historical view of the portfolio’s credit performance and is a key input for credit models used by rating agencies and investors to project future losses.
How Do Investors Monitor NPL Securitisation Performance?
Institutional investors use a structured approach to monitor their NPL securitisation investments. The process centers on analyzing detailed reports from the master servicer, which contain data for risk assessment and valuation.
Interpreting Servicer Reports and Investor Reporting
A servicing report is the primary monitoring tool. These reports, issued monthly or quarterly, detail portfolio performance. Key components include cash flow waterfalls, portfolio stratification by asset type and geography, and a KPI dashboard. Investors use these reports to compare actual performance against the original business plan and underwriting assumptions. Consistent, transparent, and timely investor reporting indicates a well-structured deal and a capable servicer. For deeper analysis, investors can consult an investor’s guide to valuing and trading NPL-backed securities.
Assessing Prepayment Risk and Constant Prepayment Rate (CPR)
The constant prepayment rate (CPR) measures the annualized percentage of a loan pool’s principal paid off ahead of schedule. While more common in performing loan securitisations, CPR is relevant in NPL deals where borrowers might settle their debt in full or assets are sold for a lump sum. A higher-than-expected CPR can accelerate cash returns to senior noteholders but may reduce total interest earned, impacting returns for junior tranches.
Optimizing Servicer Performance Through KPI Benchmarking
An NPL securitisation’s success depends on loan servicer effectiveness. Investors and originators use KPIs to measure and manage servicer performance, ensuring workout strategies are executed efficiently to maximize recoveries.
Evaluating Servicer Effectiveness with Key Metrics
Servicer effectiveness is reflected in metrics like the collection rate, resolution timelines, and recovery rates. A servicer consistently achieving a collection rate above 110% of its business plan demonstrates operational capabilities. Investors also analyze the “cure rate” (the rate at which delinquent loans become performing again) and the average time to resolve a defaulted asset. Benchmarking these metrics against industry standards and other servicers in similar markets shows a servicer’s capabilities. These metrics are part of effective loan servicing practices.
The Impact of Regulatory Changes on NPL Servicing KPIs
Europe’s regulatory environment impacts NPL servicing and reporting. Directives from the European Banking Authority (EBA) have introduced standardized definitions and reporting templates for non-performing exposures. These regulations increase market transparency and comparability, requiring servicers to adopt stricter data management and reporting practices. For investors, this enhances KPI data reliability, facilitating more accurate cross-border portfolio comparisons and due diligence.
Expert Insights: Navigating NPL Securitisation with Data
In the European distressed debt market, KPI analysis is essential for deal origination and portfolio management. Discussions at DDTalks’ NPL & Distressed Debt forums highlight a shift towards data-driven strategies among institutional investors and servicers.
Strategic Use of KPIs in European Distressed Debt Markets
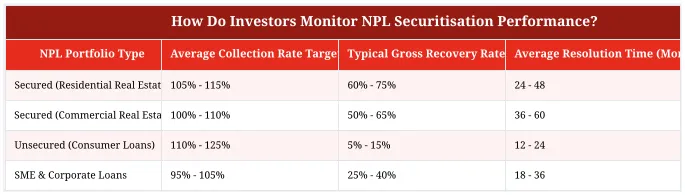
Investors are moving beyond simple KPI monitoring, using predictive analytics to forecast collections and defaults from historical KPI trends and macroeconomic data. This allows for dynamic portfolio management, including decisions on asset disposal or workout strategy adjustments. Strategic use of kpis for npl securitisation enables investors to identify mispriced risks and opportunities in markets across the Iberian Peninsula, Italy, and Central Europe. The ability to process and interpret this data is a key differentiator for success in the current NPL cycle.
View data as table
| NPL Portfolio Type | Average Collection Rate Target (%) | Typical Gross Recovery Rate (%) | Average Resolution Time (Months) |
|---|---|---|---|
| Secured (Residential Real Estate) | 105% – 115% | 60% – 75% | 24 – 48 |
| Secured (Commercial Real Estate) | 100% – 110% | 50% – 65% | 36 – 60 |
| Unsecured (Consumer Loans) | 110% – 125% | 5% – 15% | 12 – 24 |
| SME & Corporate Loans | 95% – 105% | 25% – 40% | 18 – 36 |
Beyond the Numbers: Qualitative Factors in NPL Deal Assessment
While quantitative metrics are foundational, assessment also incorporates qualitative factors like the servicer’s track record, local market expertise, and technological infrastructure. The jurisdiction’s legal and judicial framework impacts resolution timelines and recovery rates. Investor sentiment and macroeconomic stability provide context to performance indicators, as noted in a recent Reuters report on European credit markets.
Unlock Deeper NPL Insights at Our Upcoming Conferences
Understanding NPL securitisation metrics is key to informed investment and management decisions. These indicators are used to assess risk, performance, and opportunity in the European distressed debt landscape. Strategic advantage comes from discussing these trends and strategies with market leaders.
Our B2B conferences in London, Madrid, and across Europe bring together institutional investors, servicers, and advisors in the NPL market. Gain insights and make connections. For our specialized NPL and private credit forums, contact us or Request Agenda for our next event.
Conclusion
Mastering NPL securitisation KPIs provides a strategic edge in distressed debt. For investors, servicers, and financial professionals, these metrics guide investment decisions, risk management, and deal health evaluation. KPI analysis helps market participants unlock value and navigate the European NPL landscape. To discuss these topics with industry leaders, explore our B2B financial conferences. Request Agenda to join the conversation.
Frequently Asked Questions
How is the Collection Rate calculated against the servicer’s business plan in an NPL deal?
The Collection Rate is calculated by dividing the actual gross cash collected during a period by the amount forecasted in the servicer’s initial business plan for that same period. A rate consistently below 80-90% of the forecast can be an early warning sign, potentially triggering performance reviews or even servicer replacement clauses outlined in the transaction documents.
What is the difference between a Collection Rate and a Recovery Rate in NPL analysis?
The Collection Rate measures cash flow performance over a specific, short-term period, like a month or quarter, against a forecast. In contrast, the Recovery Rate is a cumulative, lifecycle metric calculated upon the final resolution of a loan, representing total gross collections as a percentage of the loan’s outstanding balance at default. Investors use collection rates for ongoing monitoring and recovery rates for ultimate deal profitability assessment.
For a portfolio containing re-performing loans (RPLs), what does the Cumulative Default Rate indicate?
The Cumulative Default Rate (CDR) in an RPL securitisation tracks the percentage of previously modified loans that have re-defaulted since the deal’s closing date. This is a critical stress indicator, as a high CDR suggests the initial underwriting assumptions about borrower stability were too optimistic. Rating agencies like Moody’s and S&P Global Ratings pay close attention to this KPI when assessing tranche risk.
Beyond collections, what operational kpis for npl securitisation should investors track for the servicer?
Investors should monitor operational metrics like the average time-to-resolution (or workout timeline) and the cost-to-collect ratio. A servicer might achieve high recovery rates but take an excessively long time or incur high legal fees, which erodes net returns for noteholders. These servicer-specific metrics are crucial for evaluating efficiency and its impact on the deal’s net present value (NPV).
How do interest coverage and overcollateralization tests function as performance indicators?
Interest Coverage (IC) and Overcollateralization (OC) tests are structural KPIs that act as safety triggers. The IC test ensures collected interest is sufficient to cover interest payments on the issued notes, while the OC test ensures the loan pool’s value exceeds the notes’ value by a specified margin. A breach of these test triggers, as defined in the prospectus, can alter the cash flow waterfall to redirect payments and protect senior noteholders.
In which specific documents can an investor find detailed NPL performance data?
Key performance data is found in the monthly or quarterly servicer and trustee reports distributed to noteholders. Investors should look for specific sections like the “Collection Report,” “Portfolio Stratification Tables,” and the “Waterfall Calculation” to find raw data on collections, delinquencies, and cash distributions. These reports are the primary source of transparency for monitoring the underlying NPL portfolio’s health.




0 Comments